
 Business License

Seawater Electrochlorination vs Chemical Dosing: A Cost and Safety Comparison for Cooling Water
A desalination plant in the Gulf region was dosing bulk sodium hypochlorite into its cooling intake at a cost of $1,800 per truckload, with deliveries arriving twice weekly. During one hot month, two deliveries were delayed at the border crossing, and the plant ran on reserve product for six days. Chlorine residual in the cooling circuit dropped below the target, and within three weeks a visible slime layer had formed on the intake screens, reducing flow by an estimated 8% and forcing an unscheduled cleaning that cost the plant $40,000 in downtime.
The plant's water treatment lead had been asking for a seawater electrochlorination system for years. The comparison he kept making is the one this article explores in detail: on-site generation versus delivered chemicals for cooling water biofouling control, judged on cost, safety, and operational reliability.
1. The Two Approaches to Cooling Water Biofouling Control
Chemical dosing is the conventional approach: a facility buys sodium hypochlorite (NaClO) solution — typically 12% to 15% available chlorine — from a chemical supplier and injects it into the cooling water intake to maintain a chlorine residual that prevents biological growth. It is simple to operate, requires modest capital, and works immediately on day one.
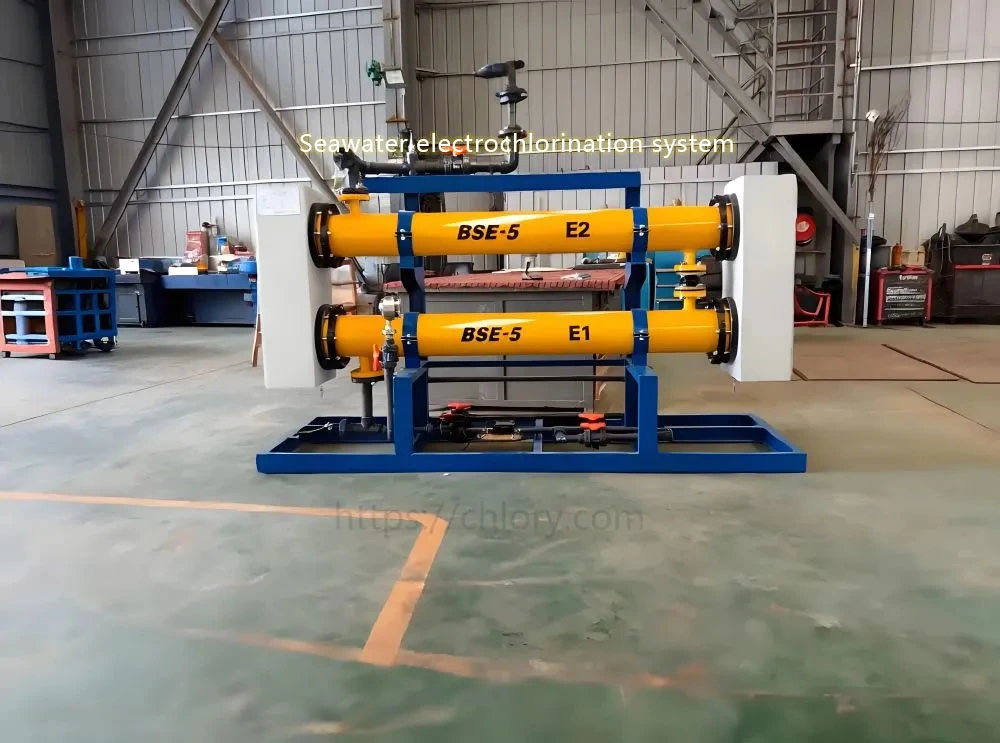
Seawater electrochlorination generates the same active chemical on-site by passing an electric current through seawater. The product is a dilute hypochlorite solution of roughly 0.5% to 1.5%, produced continuously at the point of use. Capital is higher, but the facility never depends on a delivery truck again.
Both approaches deliver the same biocide to the cooling circuit. The differences lie in the supply chain, the cost structure, and the risk profile — and those differences grow with the size and remoteness of the facility.
2. How Chemical Dosing Works and What It Really Costs
With chemical dosing, the operator's job is logistics. Bulk hypochlorite is delivered by tanker truck in 10,000 to 25,000 liter loads, stored in a chemical tank, and metered into the cooling water at a rate that maintains the target residual, typically 0.5 to 2.0 mg/L. Storage tanks, dosing pumps, residual analyzers, and spill containment are the main hardware.
The unit cost of delivered hypochlorite varies widely by region. Coastal industrial areas see $0.40 to $0.80 per liter delivered; remote sites — islands, offshore platforms, inland mining operations — can pay $1.50 to $3.00 per liter because of transport and handling. Storage losses add a further 5% to 15% per month in warm climates as the product degrades, meaning the operator pays for chlorine that evaporates before it is dosed.
Beyond the chemical itself, the true cost includes tank inspection and maintenance, spill response preparedness, hazmat permitting, and labor to receive and handle deliveries. Utilities that track these costs carefully find they add 20% to 40% to the raw chemical price.
Inventory management adds another hidden cost layer. Because bulk hypochlorite degrades over time, operators must rotate stock, dispose of expired product, and reorder on a schedule that balances delivery economics against degradation losses. A tank sized for 14 days of supply may lose a meaningful fraction of its strength before it is used in tropical climates. On-site generation removes this entire problem by producing fresh product on demand.
3. How Seawater Electrochlorination Works
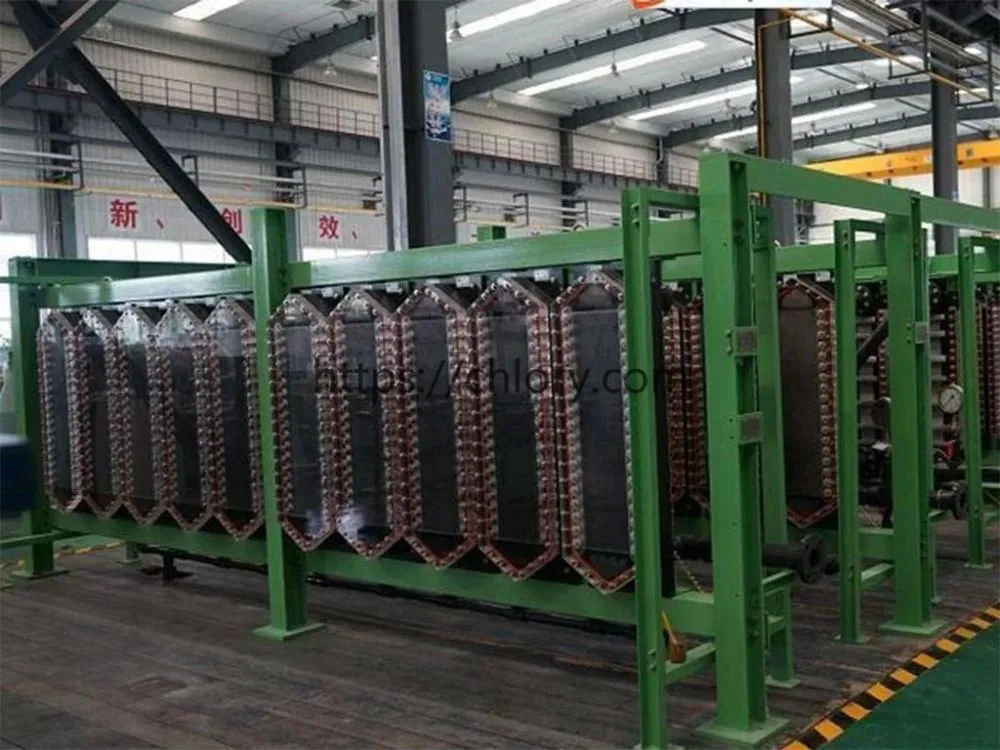
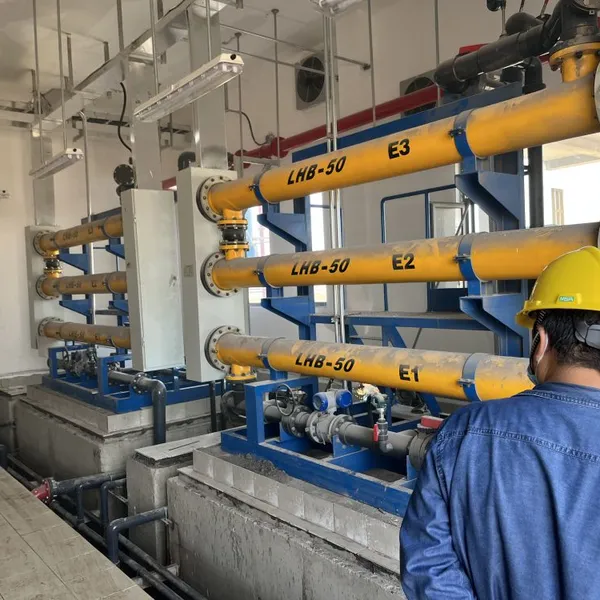
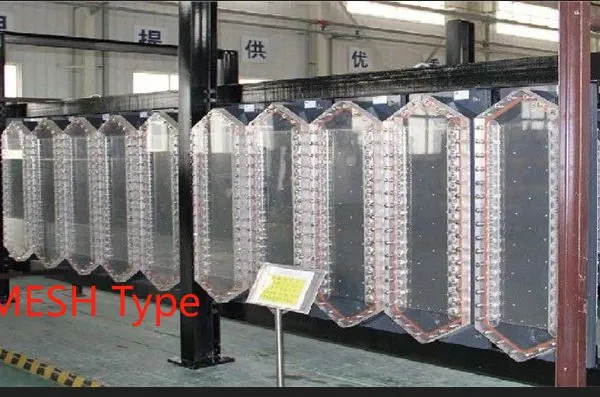
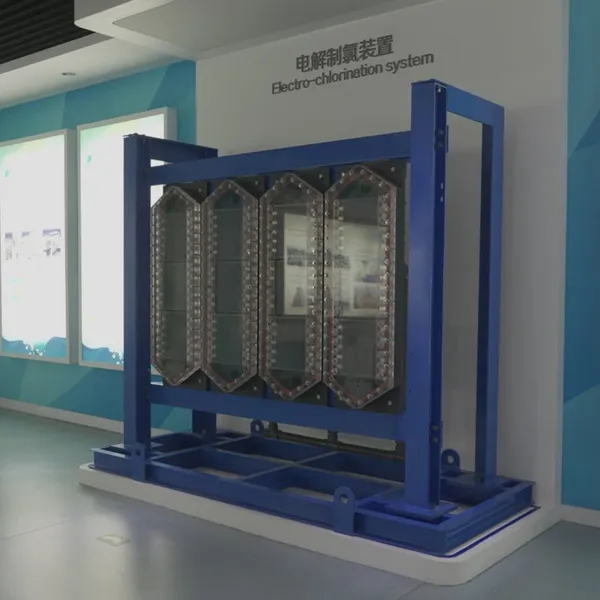
A seawater electrochlorination system draws filtered seawater, passes it through an electrolytic cell where a DC current converts chloride ions into hypochlorite, degasses the hydrogen byproduct, and delivers the dilute solution to the dosing point. The seawater feed is usually taken from the same intake as the cooling water, so the feedstock is effectively free.
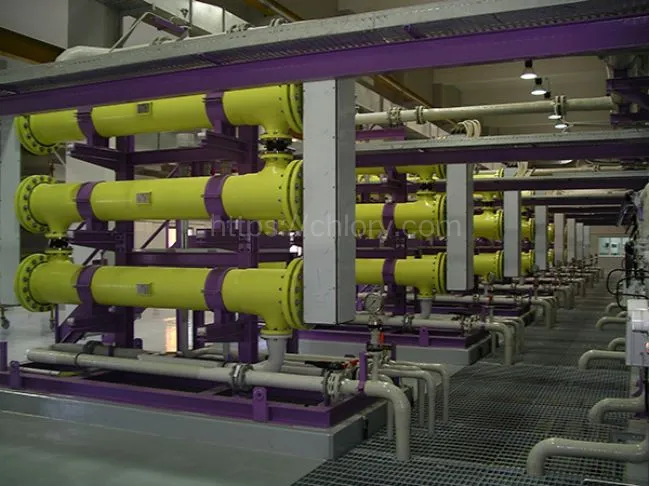
The system is sized in kilograms of equivalent chlorine per day. A mid-sized industrial plant with 10,000 m³/h of cooling flow might need 50 to 150 kg/day; a large power station can need 500 kg/day or more. The hardware — intake strainers, cells, rectifier, degassing tank, dosing pumps, and controls — is packaged on skids that bolt together on site.
Operation is largely automatic. The rectifier regulates current to hold output steady, and a residual analyzer trims the dosing rate. Day-to-day tasks are limited to cleaning strainers, checking chemistry, and occasional acid washing of the cells.
4. Capital Cost Comparison
Chemical dosing wins on capital. A complete bulk dosing system — storage tank, pumps, analyzers, containment — might cost $80,000 to $250,000 installed for a mid-sized plant. A seawater electrochlorination system with the same capacity typically costs $250,000 to $700,000 installed, with the spread driven by capacity, redundancy, and site conditions.
| Cost element | Chemical dosing | Seawater electrochlorination |
|---|---|---|
| Initial capital | $80k–$250k | $250k–$700k |
| Feedstock cost | $0.40–$3.00/L delivered | Free (seawater) + electricity |
| Energy consumption | Minimal | 3.5–5.0 kWh/kg Cl₂ |
| Storage losses | 5–15% per month | None (produced on demand) |
| Labor | Receiving, handling, inventory | Routine checks, periodic cleaning |
| Maintenance | Tanks, pumps, analyzers | Cells, rectifier, acid cleaning |
The capital gap is real, but it is the single line item in the comparison that favors chemical dosing. Every recurring cost points the other way, which is why the two approaches cross over on total cost of ownership within a few years at most facilities.
5. Operating Cost Comparison Over Five Years
Consider a mid-sized coastal plant consuming 100 kg/day of equivalent chlorine, operating 350 days per year. Chemical dosing at $0.60 per liter of 12.5% product — roughly 0.8 liters per kilogram of chlorine — costs about $16,800 per year in chemical alone. Add storage losses at 10%, delivery fees, and handling labor, and the annual chemical-side cost approaches $22,000.
Electrochlorination for the same duty consumes roughly 400 to 500 kWh per day at 4.0 to 4.5 kWh/kg. At $0.10 per kWh, electricity costs about $15,400 per year. Add maintenance, acid cleaning chemicals, and occasional anode replacement spread over the cell life — roughly $6,000 per year — and the total lands near $21,000, comparable to chemical dosing at favorable electricity prices.
The crossover flips hard when delivered prices rise or electricity falls. At $1.20 per liter delivered chemical and $0.06 per kWh power — both common in the Gulf region — electrochlorination saves on the order of $30,000 to $40,000 per year at this scale. At remote sites paying $2.00 per liter, the saving grows further.
Anode replacement is the one significant periodic cost in the electrochlorination model and deserves to be modeled honestly. A set of mixed metal oxide coated titanium anodes at this scale might cost $15,000 to $25,000 and last 5 to 8 years, translating to roughly $3,000 per year when spread over service life. Adding that to the operating model keeps the comparison fair, since chemical dosing has no equivalent line item.
6. Safety Comparison: Hazmat Logistics vs On-Site Generation
Bulk sodium hypochlorite is classified as a corrosive hazardous material under UN 1791. Its transport, storage, and handling are regulated, and every step of the supply chain is a potential incident point. Spills require containment and neutralization; fumes in confined spaces are an inhalation hazard; and mixing hypochlorite with acids or ammonia releases dangerous gases.
Electrochlorination eliminates the hazardous chemical from the supply chain entirely. The feedstocks are seawater and electricity — nothing else enters the site — and the product is a dilute solution produced and consumed on site. The hydrogen byproduct is managed by controlled dilution and venting — a well-understood engineering problem, not a chemical logistics problem.
In our experience, the safety comparison is the single strongest argument for conversion, especially for plants in populated areas or with limited emergency response capability. Tianjin Bluewav Technology Co.,ltd has delivered electrochlorination systems to coastal sites where the local fire authority had previously required dedicated hazmat response plans for bulk chemical storage; those plans were retired once generation moved on-site.
7. Reliability and Supply Assurance
Chemical dosing depends on a supply chain that the facility does not control. Delivery delays from weather, port congestion, strikes, or supplier shortages directly translate into reduced residual, and reduced residual means fouling that takes weeks to reverse. The Gulf desalination plant that opened this article is one example among many.
Electrochlorination decouples disinfection from external logistics. As long as seawater flows and power is available, the system produces chlorine. This is why remote and island facilities, where the delivered price is highest and the supply chain is weakest, are the most enthusiastic adopters.
Redundancy planning differs too. Chemical plants often keep 7 to 14 days of bulk inventory, tying up capital and floor space. Electrochlorination systems typically size the product tank for 12 to 48 hours and rely on the generator for the rest — a smaller buffer, but one that is continuously replenished from an infinite feedstock.
One reliability nuance worth noting is the impact of electricity supply. Electrochlorination assumes reliable grid power, while chemical dosing works through a blackout as long as the dosing pumps are running. Plants with weak or intermittent grid supply should either add a small standby generator for the electrolyzer or retain a reduced bulk-chemical backup, a hybrid configuration we have implemented for several island clients.
8. Environmental and Regulatory Considerations
Both approaches discharge a chlorine residual to the environment, and both must manage the same downstream byproducts — chlorate, chlorite, and trihalomethanes at trace levels. The discharge limits that apply to the cooling water outfall are identical regardless of the source of the chlorine. What differs is the environmental footprint of the supply chain itself.
Bulk chemical dosing carries an upstream footprint: manufacturing, packaging, transport fuel, and the risk of spills during delivery. Electrochlorination removes transport entirely but adds an electricity load, so its carbon footprint depends on the local grid mix. For a plant on a gas-fired or renewable-rich grid, the on-site route typically has the smaller overall footprint.
Regulatory simplification is a practical benefit that is easy to undervalue. Facilities that eliminate bulk hazardous chemical storage often remove themselves from the most demanding tier of chemical inventory reporting, emergency planning, and community right-to-know requirements. The paperwork savings alone can pay for an engineer's time for months.
9. Case Studies
A fertilizer terminal on a Pacific island had been receiving bulk hypochlorite by barge every ten days, paying an effective delivered cost above $2.00 per liter after freight and handling. Not long ago, the terminal installed a 120 kg/day seawater electrochlorination system supplied by Tianjin Bluewav Technology. In the first year, the system eliminated barge deliveries entirely, cut annual disinfection spending by roughly 60%, and survived a six-week period when barge service was suspended — with no impact on cooling water quality. The storage area once used for hypochlorite tanks was later repurposed for other terminal operations.
A petrochemical plant on the South China coast switched from a 20 m³ bulk storage tank to a 200 kg/day electrochlorination package. The plant reported recovering roughly 30 m² of occupied floor space and removing its hazmat handling training requirement, while maintaining condenser cleanliness through a full summer of peak biofouling.
10. Frequently Asked Questions
10.1 Is electrochlorination cheaper than buying sodium hypochlorite?
At delivered chemical prices below roughly $0.50 per liter and electricity above $0.12 per kWh, the two are comparable, with chemical dosing sometimes marginally cheaper on a purely cash basis. At prices above $0.80 per liter — common at remote or island sites — electrochlorination typically saves 30% to 60% of annual disinfection cost. The crossover point depends heavily on local electricity and chemical prices, so a site-specific analysis is worthwhile before deciding. Include storage degradation losses and delivery fees in that analysis, because they can shift the crossover by $0.10 to $0.20 per liter at warm-climate sites.
10.2 What is the payback period for a seawater electrochlorination system?
Payback ranges from 1.5 to 5 years depending on capacity, delivered chemical price, and electricity cost. Sites paying $1.00 per liter or more for delivered hypochlorite typically recover the capital in 1.5 to 2.5 years. Sites with moderate chemical prices and high electricity tariffs may take 4 to 5 years, at which point the safety and supply-assurance benefits still justify the investment for many operators. Anode replacement costs should be included in the model as an annualized figure, because ignoring them inflates the apparent saving by roughly 10% to 20%.
10.3 Can electrochlorination handle brackish or polluted seawater?
Yes, with appropriate pretreatment. The system requires filtered seawater with suspended solids below roughly 20 mg/L to protect the cells, and very low salinity water produces less chlorine per unit of energy. Polluted intake water containing oil or high organic loads should be avoided or pre-treated, because organic matter consumes chlorine and fouls the electrodes. A feed water analysis at the design stage settles these questions.
Sites drawing from a busy harbor or river mouth should also plan for seasonal variation, since turbidity and salinity can change markedly between wet and dry seasons.
10.4 What maintenance does an electrochlorination system need?
Routine tasks include cleaning intake strainers, checking cell voltage and current, and periodic acid washing to remove scale — typically every 3 to 6 months depending on water hardness. The anodes need replacement after roughly 5 to 8 years, and the rectifier may need component-level service over the system's 15 to 20-year life. Overall maintenance effort is comparable to a bulk dosing system, but the tasks are different and generally simpler. Logging cell voltage weekly is the single most valuable habit, because a rising voltage trend gives weeks of warning before an anode needs attention, allowing the replacement to be scheduled rather than rushed.
Recently Posted
-
Power Plant Cooling Water Biofouling Control: How Electrochlorination Replaces Chlorine Gas
September 4, 2026An aging coal-fired plant on the Atlantic coast of South America had relied on chlorine gas dosing for cooling water treatment sin Read More
 -
Advances in Electrode Coating Technology for Chlorine Generation: Longer Life, Lower Overpotential
September 4, 2026An electrochlorination plant in the Middle East was drawing 4.9 kWh per kilogram of chlorine when its cells were new. Five years l Read More
 -
How to Select a Sodium Hypochlorite Generator: 7 Key Parameters Every Buyer Should Check
September 3, 2026A municipal water utility bought a sodium hypochlorite generator based on chlorine output alone, without examining the feed water Read More
 -
Understanding Electrochlorination Technology: How Seawater Becomes a Disinfectant
September 2, 2026A coastal power plant in Southeast Asia discovered that a single season of heavy mussel growth inside its 1.6-meter cooling water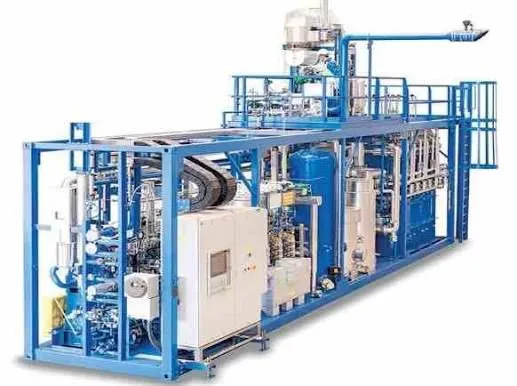 Read More

Contact Us
Recommended Products
-
 13% High Test Hypochlorite Machine for Heavy Duty DisinfectionUS$ 50000 - 300000MOQ: 1 Set
 -
9% On-Site Hypochlorite Generator for Bottled Water PlantsUS$ 50000 - 300000MOQ: 1 Set
-
14% High Purity Sodium Hypochlorite Plant for BleachingUS$ 50000 - 300000MOQ: 1 Combo
-
15% High Concentration Sodium Hypochlorite Generator for Water TreatmentUS$ 50000 - 300000MOQ: 1 Combo
-
15 Kg/h Seawater Electrolytic Antifouling System for RefineriesUS$ 50000 - 300000MOQ: 1 Set
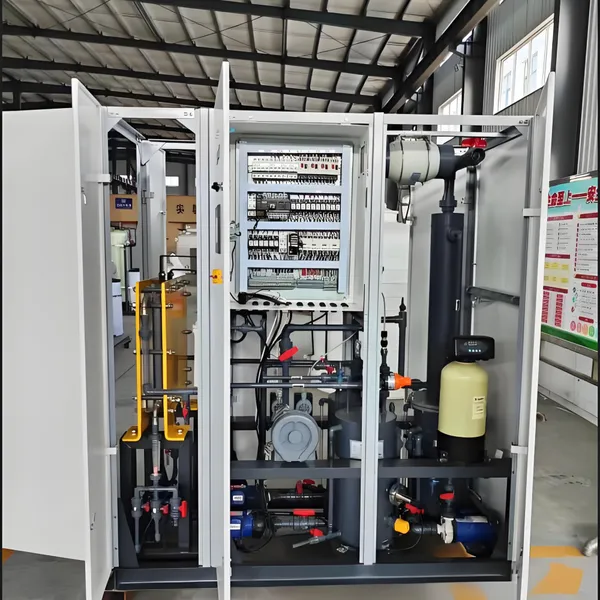
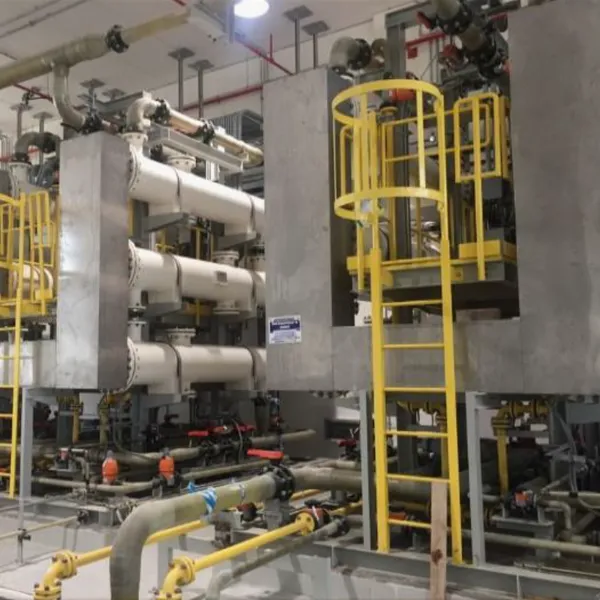
-
0.1%-0.2% Electrochlorination Unit for Seawater Cooling AntifoulingUS$ 50000 - 300000MOQ: 1 Set
-
20 Kg/day Seawater Electrolysis Plant for Coastal Power PlantsUS$ 50000 - 300000MOQ: 1 Set
-
5 Kg/h Electrolytic Seawater System for Marine Ballast TreatmentUS$ 50000 - 300000MOQ: 1 Set
-
100 M³/h Electrolytic Seawater Antifouling System for LNG TerminalsUS$ 50000 - 300000MOQ: 1 Set
-
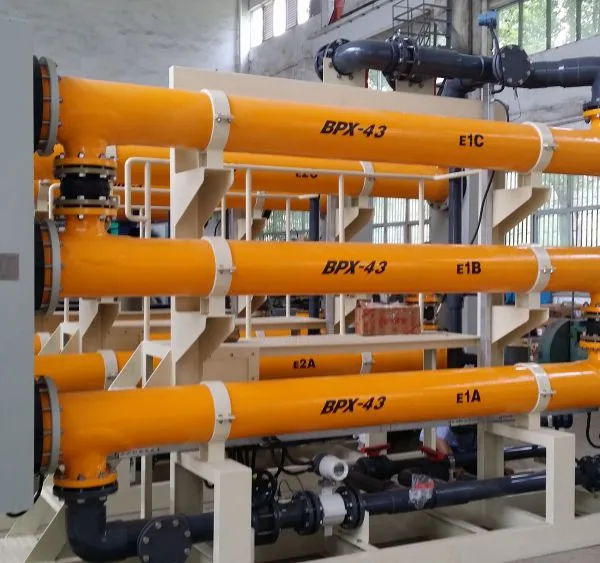
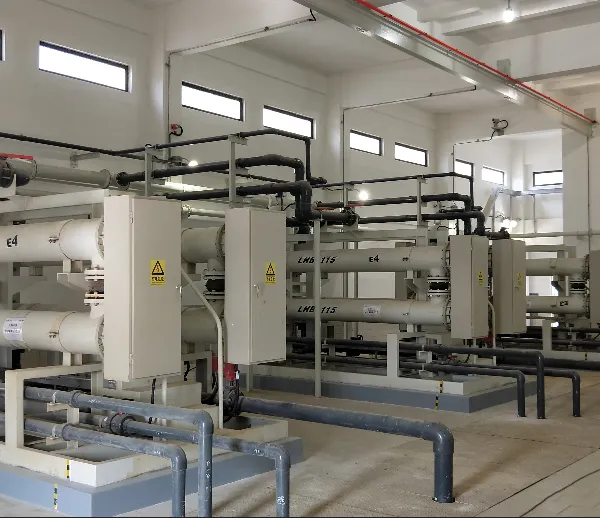
50 Ppm On-Site Sodium Hypochlorite Generator From SeawaterUS$ 50000 - 300000MOQ: 1 Set
-
Liquid Chlorine Equipment for Chlor-Alkali Production PlantUS$ 200000 - 2000000MOQ: 1 Set
-
Custom Chlor-Alkali Plant EPC Turnkey Solution for Integrated Chemical Manufacturing PlantUS$ 100000 - 2000000MOQ: 1 Set
-
99% High Purity Caustic Soda Flakes EPC Project for Fine Chemical & Metallurgical IndustryUS$ 100000 - 2000000MOQ: 1 Set
-
33% Industrial Hydrochloric Acid Production Equipment for Pickling & Wastewater TreatmentUS$ 100000 - 2000000MOQ: 1 Set
-
Industrial Liquid Chlorine Production & Storage Equipment for Chemical Synthesis & Water DisinfectionUS$ 100000 - 2000000MOQ: 1 Set
-
100kg/hour WPC80 Concentrated Whey Protein Powder Production Line Membrane Filtration Concentration EquipmentUS$ 50000 - 500000MOQ: 1 Set
-
Full-Automatic Beverage Processing Machinery Whole Production Line Membrane Clarification Membrane Filtration EquipmentUS$ 50000 - 500000MOQ: 1 Set
-
Instant Tea Whole Product Line Membrane Filtration, Concentration and Dehydration EquipmentUS$ 50000 - 500000MOQ: 1 Set
-
Goat Milk Sterilization and Concentration SystemUS$ 50000 - 500000MOQ: 1 Set
-
Sanitary Nanofiltration Membrane Dealcoholization System Low Alcohol Wine Beer Filtration EquipmentUS$ 50000 - 500000MOQ: 1 Set